
製品
Homogenization Analysis of the Conductive Adhesive
Semiconductor packages have heterogeneous structures that are varied and complex, consisting of a variety of materials such as ceramics, metal, and resin. Components and parts with extremely large scale ratios are mixed when considering the scale (size) of them, from the order of nanometers, such as a wiring pitch, up to the micro-millimeter order, such as a heat sink. In these cases, detail modeling for whole structures with large scale differences is too costly and is not realistic by analysis based on finite element method (FEM) but it would be effective using some simplified procedure.
CMAS has a homogenization analysis function for evaluating the equivalent property value to replace the homogeneous body of complex heterogeneous structures. Here, we will introduce the homogenization analysis example of Ag-epoxy conductive adhesive which is substituted for solder.
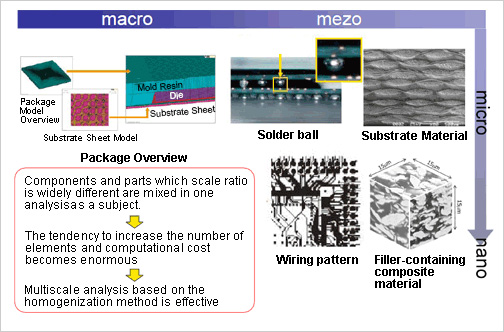
Figure 1. Problems in the Semiconductor Package Analysis
Analysis Model
Micro model test piece creation for numerical material test
Conductive adhesive used in a semiconductor package has a heterogeneous structure because of the Ag-filler which is dispersed into the epoxy resin. If there is an alignment pattern to the filler, elastic properties are also expressed in anisotropy. However, numerical material test by FEM is enabled since it is difficult to determine in the experiment and might also be composed of a thin layer.
It is a big key to increase the test accuracy and how modeling can be accurate from an actual structure in the numerical material test. In here, microstructures of the adhesive in the depth direction plurality were observed with a microscope, and converted to a solid model for CMAS by image processing. Temperature dependences and material property values are defined respectively for resin and filler in the numerical material test. Numerical material tests were performed on respective environmental temperatures in six independent directions, and evaluated equivalent property values of the viscoelasticity and anisotropy of elastic modulus by curve fitting the obtained apparent response.。
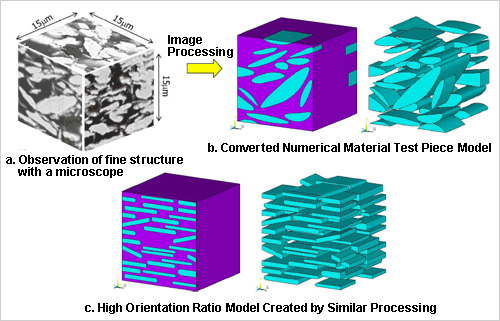
Figure 2. Numerical Material Test Piece and Flow of Model Creation
Analysis Results
Static Numerical Material Test Contour
Figure 3 shows numerical material test results (equivalent stress contour) on the elastic material that was defined. Stress value of the filler is responsible and has been closely related to the apparent stiffness in the composite structure that contained high rigidity filler as compared to the matrix. For example, stress is concentrated on the filler in the high orientation model compared to the low orientation index model when we observe the uniaxial strain test results in the x direction that are arranged in the high orientation model. That is, we can verify the state that the filler is responsible for increasing the axial force. On the other hand, how it does not contribute to the apparent stiffness of the filler also can be confirmed since relatively large stress also occurs in both matrix models in the test results on the small orientation ratio in the y-direction. In this way, it is possible to obtain the knowledge better than in experiments since it is possible to evaluate in detail the distribution of stress and strain of fine areas that are difficult to measure (including inside the test piece) in the numerical material test.
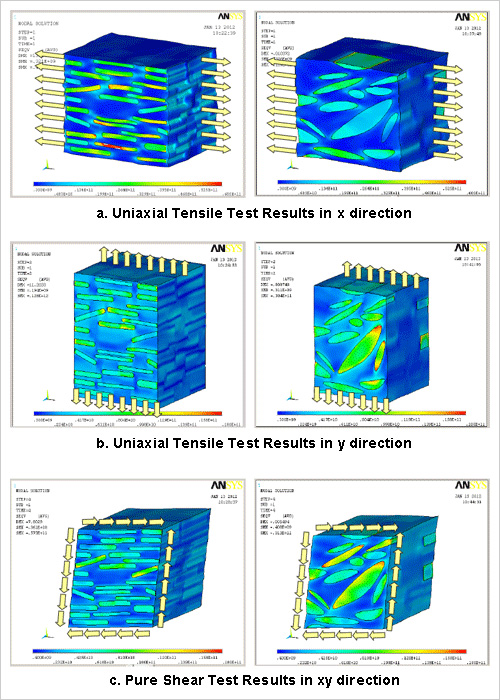
Figure 3. Equivalent Stress Contour During Elastic Numerical Material Test
Left: High orientation rate model, Right: Low orientation rate model
Homogenization Analysis Results (Elastic Coefficient)
Figure 4 shows the characteristics of equivalent property value obtained by the static uniaxial strain test in six directions. A state that appears strong anisotropy in the direction of the filler orientation in high orientation rate model, whereas the anisotropy is behaving weakly pseudo-isotropic in both uniaxial and shear direction in low orientation rate model can be confirmed.
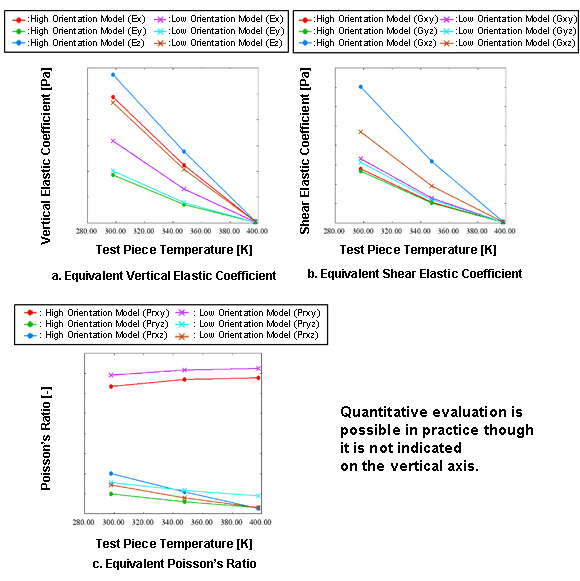
Figure 4. Elastic Homogenization Analysis
Homogenization Analysis Results (Viscoelasticity Characteristic)
It is also possible to evaluate material response of speed-dependent if the characteristics of the viscoelastic or creep is defined to the resin. In Multisclae.Sim, it is possible to be completed in this one tool to a series of material tests up to physical properties evaluation since the curve fitting feature and anisotropic viscoelastic material constitutive law has been implemented by the user subroutine.
Figure 5 is the results of stress relaxation test in six directions to the low orientation rate model. Anisotropy is also reflected in the relaxation characteristic similar to the elastic modulus. It is possible to observe these responses and able to fit high accuracy in CMAS.
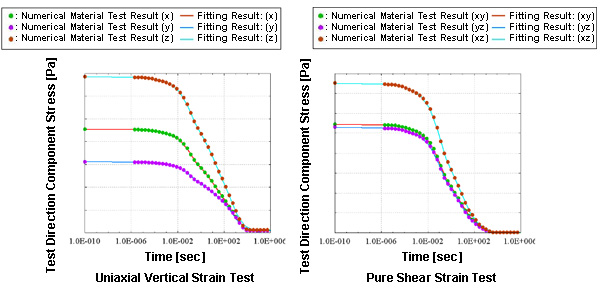
Figure 5. Stress Relaxation Test of Low Orientation Rate Model and Its Fitting Results
Data Providing Source
Associate Professor Yoshiharu Kariya, Shibaura Institute of Technology
Analysis Types
Structural Analysis、 Multiscale Analysis、 Homogenization Analysis